Data Exploration
These plots are in beta, if you get an error while computing them please let us know.
Histogram of valid sensed hours
See Histogram of Valid Sensed Hours Config Code
Rule Chain:
- Rule:
rules/preprocessing.smk/download_dataset - Rule:
rules/preprocessing.smk/readable_datetime - Rule:
rules/preprocessing.smk/phone_sensed_bins - Rule:
rules/preprocessing.smk/phone_valid_sensed_days - Rule:
rules/reports.smk/histogram_valid_sensed_hours
Parameters of histogram_valid_sensed_hours Rule:
| Name | Description |
|---|---|
| plot | Whether the rule is executed or not. The available options are True and False. |
| min_valid_bins_per_hour | The minimum valid bins an hour should have to be considered valid. A valid bin has at least 1 row of data. It modifies the way we compute phone valid days. Read PHONE_VALID_SENSED_BINS for more information. |
| min_valid_hours_per_day | The minimum valid hours a day should have to be considered valid. It modifies the way we compute phone valid days. Read PHONE_VALID_SENSED_DAYS for more information. |
Observations:
This histogram shows the valid sensed hours of all participants processed in RAPIDS (See valid sensed bins and days sections). It can be used as a rough indication of the AWARE client monitoring coverage during a study for all participants. See Figure 1.
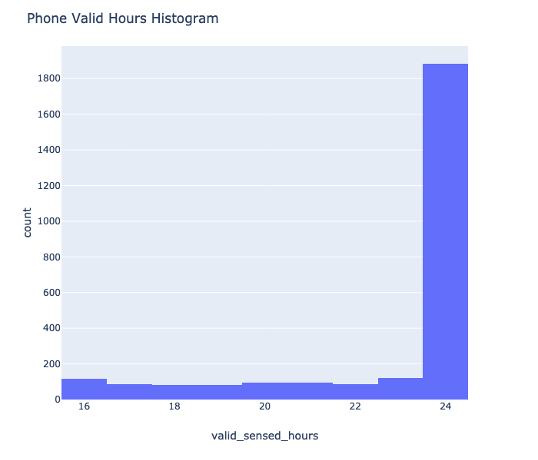
Figure 1 Histogram of valid sensed hours for all participants
Heatmap of phone sensed bins
See Heatmap of Phone Sensed Bins Config Code
Rule Chain:
- Rule:
rules/preprocessing.smk/download_dataset - Rule:
rules/preprocessing.smk/readable_datetime - Rule:
rules/preprocessing.smk/phone_sensed_bins - Rule:
rules/reports.smk/heatmap_sensed_bins
Parameters of heatmap_sensed_bins Rule:
| Name | Description |
|---|---|
| plot | Whether the rule is executed or not. The available options are True and False. |
| bin_size | Every hour is divided into N bins of size BIN_SIZE (in minutes). It modifies the way we compute data/interim/pXX/phone_sensed_bins.csv file. |
Observations:
In this heatmap rows are dates, columns are sensed bins for a participant, and cells’ color shows the number of mobile sensors that logged at least one row of data during that bin. This plot shows the periods of time without data for a participant and can be used as a rough indication of whether time-based sensors were following their sensing schedule (e.g. if location was being sensed every 2 minutes). See Figure 2.
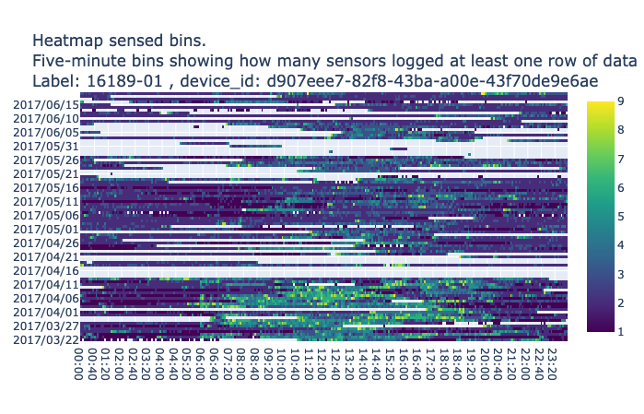
Figure 2 Heatmap of phone sensed bins for a single participant
Heatmap of days by sensors
See Heatmap of Days by Sensors Config Code
Rule Chain:
- Rule:
rules/preprocessing.smk/download_dataset - Rule:
rules/preprocessing.smk/readable_datetime - Rule:
rules/preprocessing.smk/phone_sensed_bins - Rule:
rules/preprocessing.smk/phone_valid_sensed_days - Rule:
rules/reports.smk/heatmap_days_by_sensors
Parameters of heatmap_days_by_sensors Rule:
| Name | Description |
|---|---|
| plot | Whether the rule is executed or not. The available options are True and False. |
| min_valid_bins_per_hour | The minimum valid bins an hour should have to be considered valid. A valid bin has at least 1 row of data. It modifies the way we compute phone valid days. Read PHONE_VALID_SENSED_BINS for more information. |
| min_valid_hours_per_day | The minimum valid hours a day should have to be considered valid. It modifies the way we compute phone valid days. Read PHONE_VALID_SENSED_DAYS for more information. |
| expected_num_of_days | The number of days of data to show starting from the first day of each participant. |
| db_tables | List of sensor tables to compute valid bins & hours. |
Observations:
In this heatmap rows are sensors, columns are days and cells’ color shows the normalized (0 to 1) number of valid sensed hours (See valid sensed bins and days sections) collected by a sensor during a day for a participant. The user can decide how many days of data to show starting from the first day of each participant. This plot can used to judge missing data on a per participant, per sensor basis as well as the number of valid sensed hours (usable data) for each day. See Figure 3.
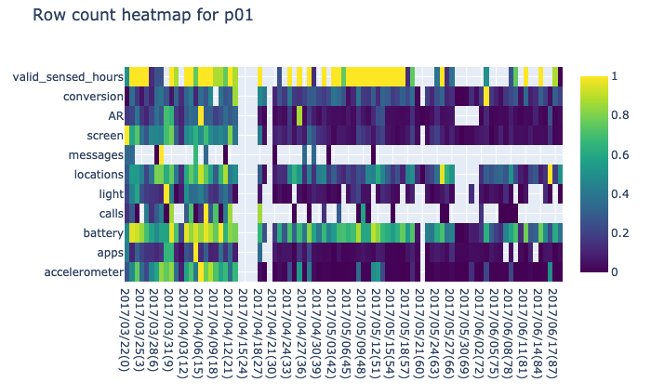
Figure 3 Heatmap of days by sensors for a participant
Overall compliance heatmap
See Overall Compliance Heatmap Config Code
Rule Chain:
- Rule:
rules/preprocessing.smk/download_dataset - Rule:
rules/preprocessing.smk/readable_datetime - Rule:
rules/preprocessing.smk/phone_sensed_bins - Rule:
rules/preprocessing.smk/phone_valid_sensed_days - Rule:
rules/reports.smk/overall_compliance_heatmap
Parameters of overall_compliance_heatmap Rule:
| Name | Description |
|---|---|
| plot | Whether the rule is executed or not. The available options are True and False. |
| only_show_valid_days | Whether the plot only shows valid days or not. The available options are True and False. |
| expected_num_of_days | The number of days to show before today. |
| bin_size | Every hour is divided into N bins of size BIN_SIZE (in minutes). It modifies the way we compute data/interim/pXX/phone_sensed_bins.csv file. |
| min_valid_bins_per_hour | The minimum valid bins an hour should have to be considered valid. A valid bin has at least 1 row of data. It modifies the way we compute phone valid days. Read PHONE_VALID_SENSED_BINS for more information. |
| min_valid_hours_per_day | The minimum valid hours a day should have to be considered valid. It modifies the way we compute phone valid days. Read PHONE_VALID_SENSED_DAYS for more information. |
Observations:
In this heatmap rows are participants, columns are days and cells’ color shows the valid sensed hours for a participant during a day (See valid sensed bins and days sections). This plot can be configured to show a certain number of days before today using the EXPECTED_NUM_OF_DAYS parameter (by default -1 showing all days for every participant). As different participants might join the study on different dates, the x-axis has a day index instead of a date. This plot gives the user a quick overview of the amount of data collected per person and is complementary to the histogram of valid sensed hours as it is broken down per participant and per day. See Figure 4.
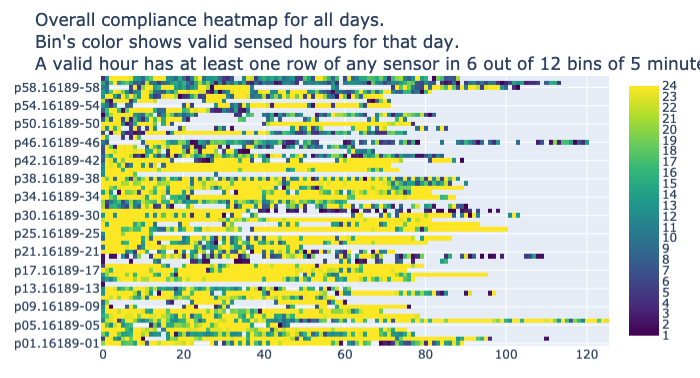
Figure 4 Overall compliance heatmap for all participants
Heatmap of correlation matrix between features
See Heatmap of Correlation Matrix Config Code
Rule Chain:
- Rules to extract features
- Rule:
rules/preprocessing.smk/download_dataset - Rule:
rules/preprocessing.smk/readable_datetime - Rule:
rules/preprocessing.smk/phone_sensed_bins - Rule:
rules/preprocessing.smk/phone_valid_sensed_days - Rule:
rules/reports.smk/heatmap_features_correlations
Parameters of heatmap_features_correlations Rule:
| Name | Description |
|---|---|
| plot | Whether the rule is executed or not. The available options are True and False. |
| min_valid_bins_per_hour | The minimum valid bins an hour should have to be considered valid. A valid bin has at least 1 row of data. It modifies the way we compute phone valid days. Read PHONE_VALID_SENSED_BINS for more information. |
| min_valid_hours_per_day | The minimum valid hours a day should have to be considered valid. It modifies the way we compute phone valid days. Read PHONE_VALID_SENSED_DAYS for more information. |
| corr_method | Method of correlation. The available options are pearson, kendall and spearman. |
| min_rows_ratio | Minimum number of observations required per pair of columns to have a valid correlation coefient. Currently, only available for pearson and spearman correlation. |
| phone_features | The list of phone features. |
| fitbit_features | The list of Fitbit features. |
| corr_threshold | Only correlation coefficients larger than corr_threshold can be shown in the heatmap. |
Observations:
Columns and rows are features computed in RAPIDS, cells’ color represents the correlation coefficient between all days of data for every pair of feature of all participants. The user can specify a minimum number of observations required to compute the correlation between two features using the MIN_ROWS_RATIO parameter (0.5 by default). In addition, this plot can be configured to only display correlation coefficients above a threshold using the CORR_THRESHOLD parameter (0.1 by default). See Figure 5.
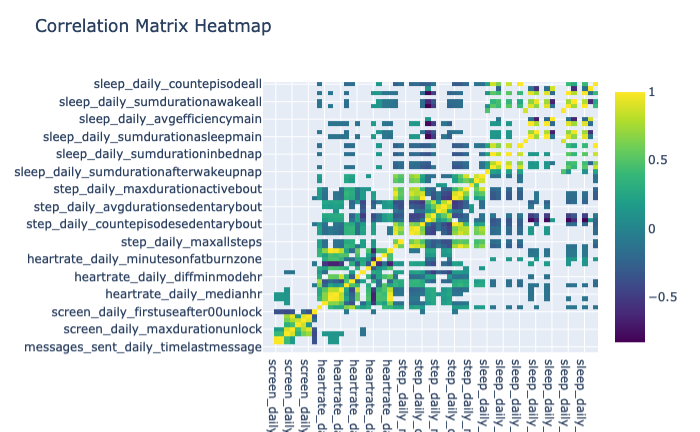
Figure 5 Correlation matrix heatmap for all the data of all participants